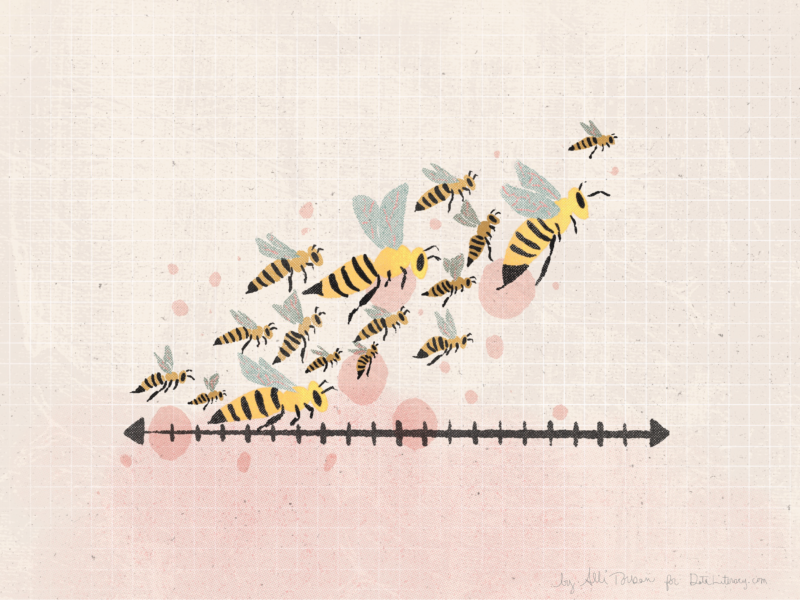
The beauty of bee swarm plots

Visualizing data distributions is one of the most important steps in exploratory analysis. In this post, I’ll be showing you how to incoporate bee swarm plots as one of your available options using real data from The World Justice Project.

By Carlos A. Toruño P.

March 5, 2023

Geocoding and visualizing address information with R

When dealing with online data, we frequently encounter information about locations. In this post, I will be showing you how to transform this information into geographical coordinates using R programming language.

By Carlos A. Toruño P.

December 21, 2022

Web Scraping using Selenium

In the third part of this series, I use the Selenium library to locate web elements and extract information from dynamic web sites.

By Carlos A. Toruño P.

December 9, 2022

The Data Viz process

Coming up with the almost perfect visualization for your data is not easy task. In this post, I go through my Data Visualization process as part of my daily routine.

By Carlos A. Toruño P.

November 24, 2022

Web Scraping using Requests and Beautiful Soup

Web Scraping is an increasingly popular tool to gather information from the web. In the second part of this series, I use the requests and BeautifulSoup Python libraries to extract information from a website.

By Carlos A. Toruño P.

November 17, 2022